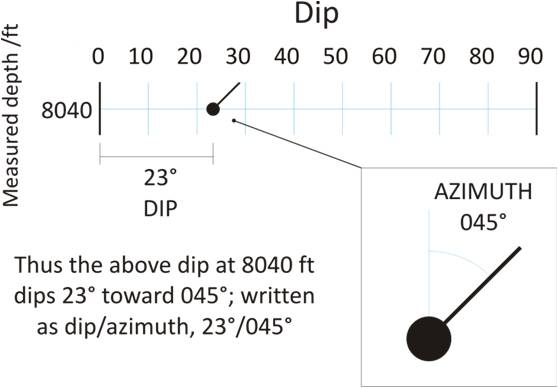
 A pictorial method in two dimensions using glyphs to illustrate the orientation of planar features derived from borehole images or dipmeters at a given depth. The Y-axis is depth and the X-axis (scaled 0°-90°) is dip (feature inclination from the horizontal). A point is plotted as a large circle and the associated azimuth projected out with the Y-axis as true north, forming a tadpole-shaped graphical display. Tadpole colours and shapes can be varied to distinguish different dip types and dip quality.
See also dip quality, manual dips and azimuth vector plots.