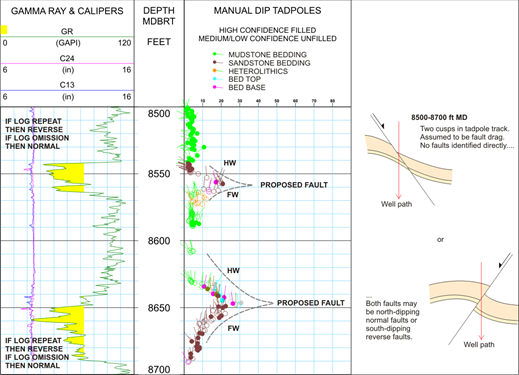
- Filtering of manual dip data to extract indicators of the palaeohorizontal during deposition.
- Display of such data on tadpole plots, azimuth plots and rose histograms.
- Vector analysis (including azimuth walkouts and cumulative dip magnitude plots) to identify orientation changes between structural zones.
- Stereographical analysis of filtered bedding data by zone to generate representative structural dips defining post-depositional (generally tectonic) rotation.
- Identification of probable faults by direct observation, bedding drag and fractures (damage zones).
- Presentation of fracture and fault data by type as stereoplots.
- Examination and interpretation of structural zone boundaries into e.g. unconformities, faults, palaeohorizontal changes.

