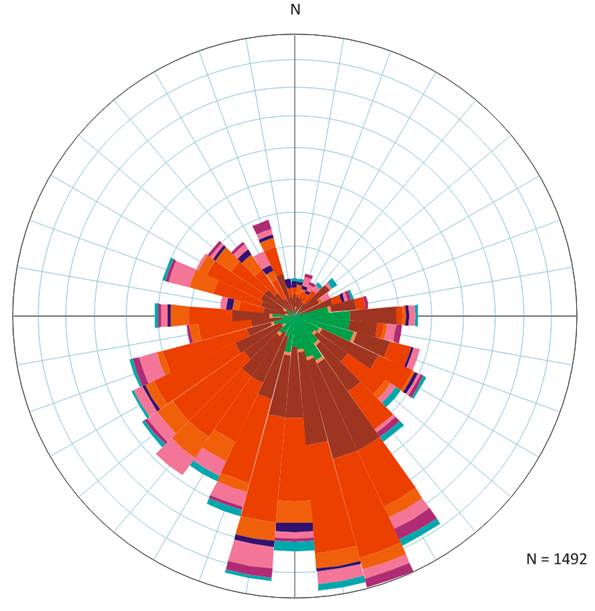
 Graphical circular histogram used to present oriented data either as azimuths or strikes. The area of each sector (equivalent to bin width in the more usual histograms) is made proportional to square root of the class frequency. A degraded case can be presented with the radius of the sector proportional to the class frequency, although this results in over emphasis of high frequencies. See text figure on the left for example.
The first recorded use of a rose diagram was in 1858 by Florence Nightingale, a Victorian nurse reformer of the British Army’s medical facilities and popular heroine of the Crimean war to show mortality against month of the year.
CHEENEY, R. F. 1983. Statistical Methods in Geology, George Allen & Unwin, London, p169.
FISHER, N. I. 1993. Statistical Analysis of Circular Data. CUP, Cambridge, p277.
See also mean direction, azimuth vector plot, Hurley plot and stereonets.