 Graphical tool for presentation, analysis and interpretation of three-dimensional planar data. A tangent diagram allows the presentation of three-dimensional information onto a two-dimensional plane (usually as a piece of paper or computer image). It can be used as an alternative to the stereonet and has been popularised by Bengtson (1980).
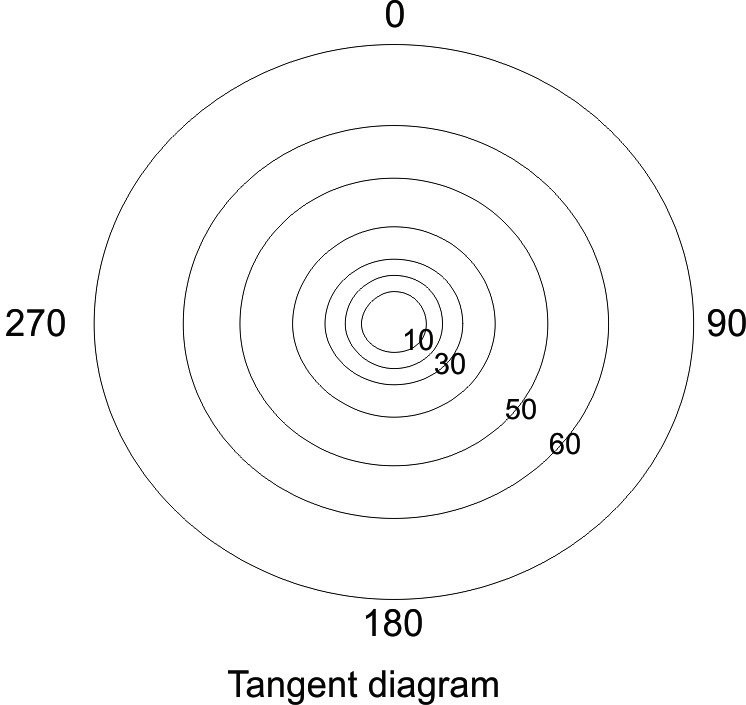
Plots are completed on pre-formatted diagrams. A series of concentric circles are drawn with their radius representing the dip value and their spacing proportional to the tangent of the dip, with the centre equal to 0º dip. The outermost circle (representing the azimuth of a plane) is marked as a conventional compass with north (0º) to the top of the figure. The attitudes of planes are quickly plotted across the figure.
Tangent diagrams allow a speedy determination of mean dip and apparent dips. The attitude of plotted planes allows recognition of plunging and non-plunging cylindrical folds, and conical folds, but they can be limited in that steep dips require very large sheets of paper.
BENGTSON, C. A. 1980. Geology, 8, 599-602.
GROSHONG, R. H. Jr. 1999. 3-D Structural Geology, Springer, Berlin, p324.
See also azimuth plot, dip plot, azimuth versus dip plot, SCAT plots, stereoplots.