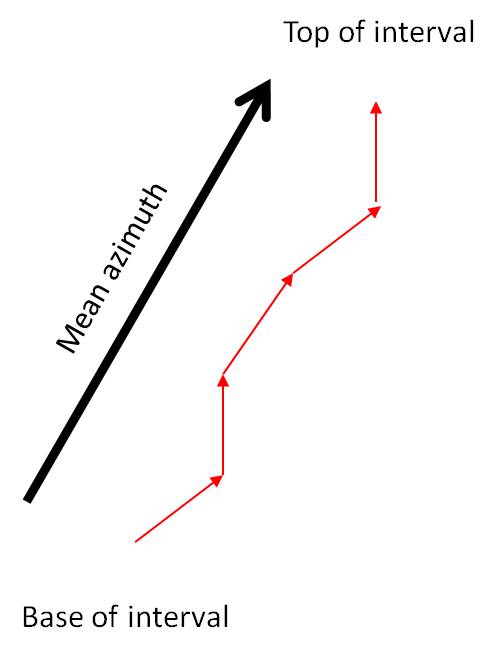
 Azimuth vector plots (sometimes known as walkout plots) are a graphical representation of cumulatively added directed orientation data, usually azimuths. These plots are generated by the head-to-tail stacking of unit vectors sequentially up through a given succession. Each azimuth is drawn from the population of derived dip data (e.g. tadpoles). They provide a visual running average of mean azimuth for a studied succession. In the study of structural tilt variation shale beds usually provide the most useful data. Azimuth vector plots are useful in determining subtle azimuth changes through a studied interval. The angle between the initial (basal) and last (uppermost) unit vector represents the mean vector azimuth for the complete plotted data set. Also used for sediment dispersal analysis.
Variations on these plots can include the plotting of strike data from fracture and faults and for example they have been used to detect geological hazards forward of the face from changes in coal cleat strikes.
See also Hurley plots and tadpole plots.
FISHER, N. I. 1993. Statistical Analysis of Circular Data. CUP, Cambridge, p277.